

Since factors like shifting privacy regulations and smarter inbox algorithms have become more important, email marketing in 2026 relies more on tracking the right data rather than just hitting send and hoping for the best.
Knowing how to interpret that data, however, is a challenge in itself, as you need to see how those numbers connect to your goals and make a difference.
So our team has broken down all the essential KPIs every marketer should keep an eye on and how to interpret them, from open rates and click-throughs to more nuanced ones that show real engagement.
Core Categories of Email Marketing KPIs
Email metrics can be grouped into a few core categories:
Engagement Metrics
Engagement metrics tell you how subscribers interact with your emails. Are they opening your messages? Clicking links? Reading the content?
Open Rate
Open rate is the percentage of delivered emails that were opened. It used to be the go-to engagement metric
However, Apple’s Mail Privacy Protection (MPP), introduced in late 2021, preloads email images (including tracking pixels) even if the user doesn’t actually open the email.
This causes inflated open rates that don’t always represent human eyes on your content, which means open rate is no longer as reliable. So in 2026, treat open rates as a very rough indicator. If you notice Apple Mail users showing 100% open rates, that’s likely the MPP effect, not genuine engagement.
Best Practices
Focus on trends more than absolute open numbers. Many marketers now exclude Apple opens or use proxy metrics. Some advanced email platforms use predictive engagement models, which are essentially AI that predicts engagement based on past behavior and other signals.
Instead of relying solely on reported opens, they might score subscribers by:
- Recent clicks
- Site activity
- In-email read-time
Click-Through Rate (CTR)
CTR tells you who actually engaged further by clicking a link. For example, if you sent 1,000 emails and 50 people clicked, your CTR is 5%.
Many email reports also show unique CTR (counting each subscriber only once) versus total clicks (counting every click, including multiple clicks by the same person).
Both are useful: unique CTR tells you what fraction of your audience took action, while total clicks show depth of interest (e.g. someone clicked 3 different links because they were really interested in your content).
Click-To-Open Rate (CTOR) is similar, but it’s the percentage of openers who clicked. It measures how compelling your email content and call-to-action were after the email was opened.
However, by 2026, CTOR has also become less reliable, because if the open number is inflated or “noisy” from auto-opens, then CTOR (clicks divided by opens) can plummet for reasons unrelated to content.
CTR vs. CTOR: Which Matters More in 2026?
The consensus is to prioritize CTR (or total click counts) for a more stable measure of engagement. Click-through rate is not affected by invisible opens because a click is an intentional action by a person.
CTOR can still be looked at in context, but be careful with it. For example, if you segment out non-Apple clients, CTOR could be useful to compare content performance for that segment. But generally, a straight CTR gives you a cleaner read nowadays on engagement.
Read Time (Scroll Depth or Dwell Time)
This measures how long a subscriber keeps the email open or how far they scroll. Not all email clients report this, but some do provide a proxy: for example, certain email analytics tools categorize opens as:
- “Glanced” (a couple seconds)
- “Skimmed” (a few seconds)
- “Read” (perhaps 8+ seconds)
Use read time or scroll data to optimize your email format. If few people scroll to the bottom, maybe your emails are too long or the top section isn’t enticing enough to continue.
If read time is high but clicks are low, maybe the email itself delivered what was needed, or perhaps you should include a clearer call-to-action to drive external engagement.
Conversion Metrics
Conversion metrics track how well your emails are accomplishing your business objectives:
Conversion Rate: How effective your email was at driving the end goal. It’s arguably one of the most important KPIs because it ties directly to business results (especially for e-commerce and direct-response campaigns).
You can track conversions in Google Analytics 4 (GA4).
- Revenue per Email (RPE) or ROI: This tells you the earning power of each email address on your list for that send. Email marketing delivers one of the highest ROI among marketing channels, even higher than SMS.
Customer Lifetime Value (CLV or LTV) Attributed to Email: This is more of a strategic metric, but it estimates how much revenue a single subscriber (or customer acquired via email) will generate over the long term.
If you can calculate that, you can make smarter decisions about how much to invest in growing your list or what kinds of offers to send.
List Health Metrics
Here are the key list hygiene KPIs to watch:
Bounce Rate (Soft vs. Hard Bounces)
Bounce rate is the percentage of emails that couldn’t be delivered to the recipient’s inbox. There are two types of bounces.
Hard bounces are permanent failures, so invalid email addresses (typo in the email, or a domain that doesn’t exist) or an address that no longer exists. Soft bounces are temporary issues, like the recipient’s mailbox was full or the email was too large
Hard bounces should be removed from your list immediately (since they’ll never succeed in the future), while soft bounces can be retried for a little while (often ESPs auto-retry a soft bounce a couple times, or you might keep the address on the list but monitor if it keeps bouncing soft).
An “acceptable” bounce rate in 2026 is pretty low. Ideally, it should be under 1-2% for most campaigns. And hard bounces should be as close to 0% as possible.
A high bounce rate can hurt your sender reputation with ISPs (Internet Service Providers) - if Gmail sees that 10% of your emails are bouncing, they suspect your list is stale or purchased (which often correlates with spammy senders). It helps to use tools like ZeroBounce to detect fake or problem emails before you hit send.
Unsubscribe Rate
This is the percentage of recipients who opt out of your mailing list via the unsubscribe link, per email sent. For example, if you send to 1,000 people and 5 unsubscribe, that’s a 0.5% unsubscribe rate for that campaign. We tend to look at the unsub rate as an indicator of how our content/frequency is resonating (or not).
Industry benchmarks say generally below 0.3% per send is normal, and anything consistently above 0.5-1% is cause for concern. If you’re regularly hitting 1% or higher, you’re shedding subscribers too fast.
But a very low unsubscribe rate isn’t always good news because it could mean people have lost interest but can’t be bothered to unsubscribe, so they just ignore your emails or filter them out.
This leads to low engagement, which can hurt deliverability (ISPs notice if lots of people ignore/delete without reading).
That said, if your unsubscribe rate jumps or is higher than normal, dig into it. Check if it was a certain segment or a certain type of email that caused it. Many ESPs allow an unsubscribe survey (asking users why they left). Feedback like “emails too frequent" or “content not relevant” is gold because it helps you adjust your strategy.
Spam Complaint Rate
This is the percentage of recipients who marked your email as “spam” or “junk.” Almost all email clients have that “Report Spam” button, and if someone clicks it on your email, it sends a complaint signal (through feedback loops) to your ESP.
You can minimize this rate by how you build your list:
- Always use opt-in (people explicitly signed up)
- Never buy lists or scrape emails (those people don’t know you and will hit spam)
- Set clear expectations when people subscribe (tell them what you’ll send and how often)
- Ensure every email provides value and isn’t deceptive
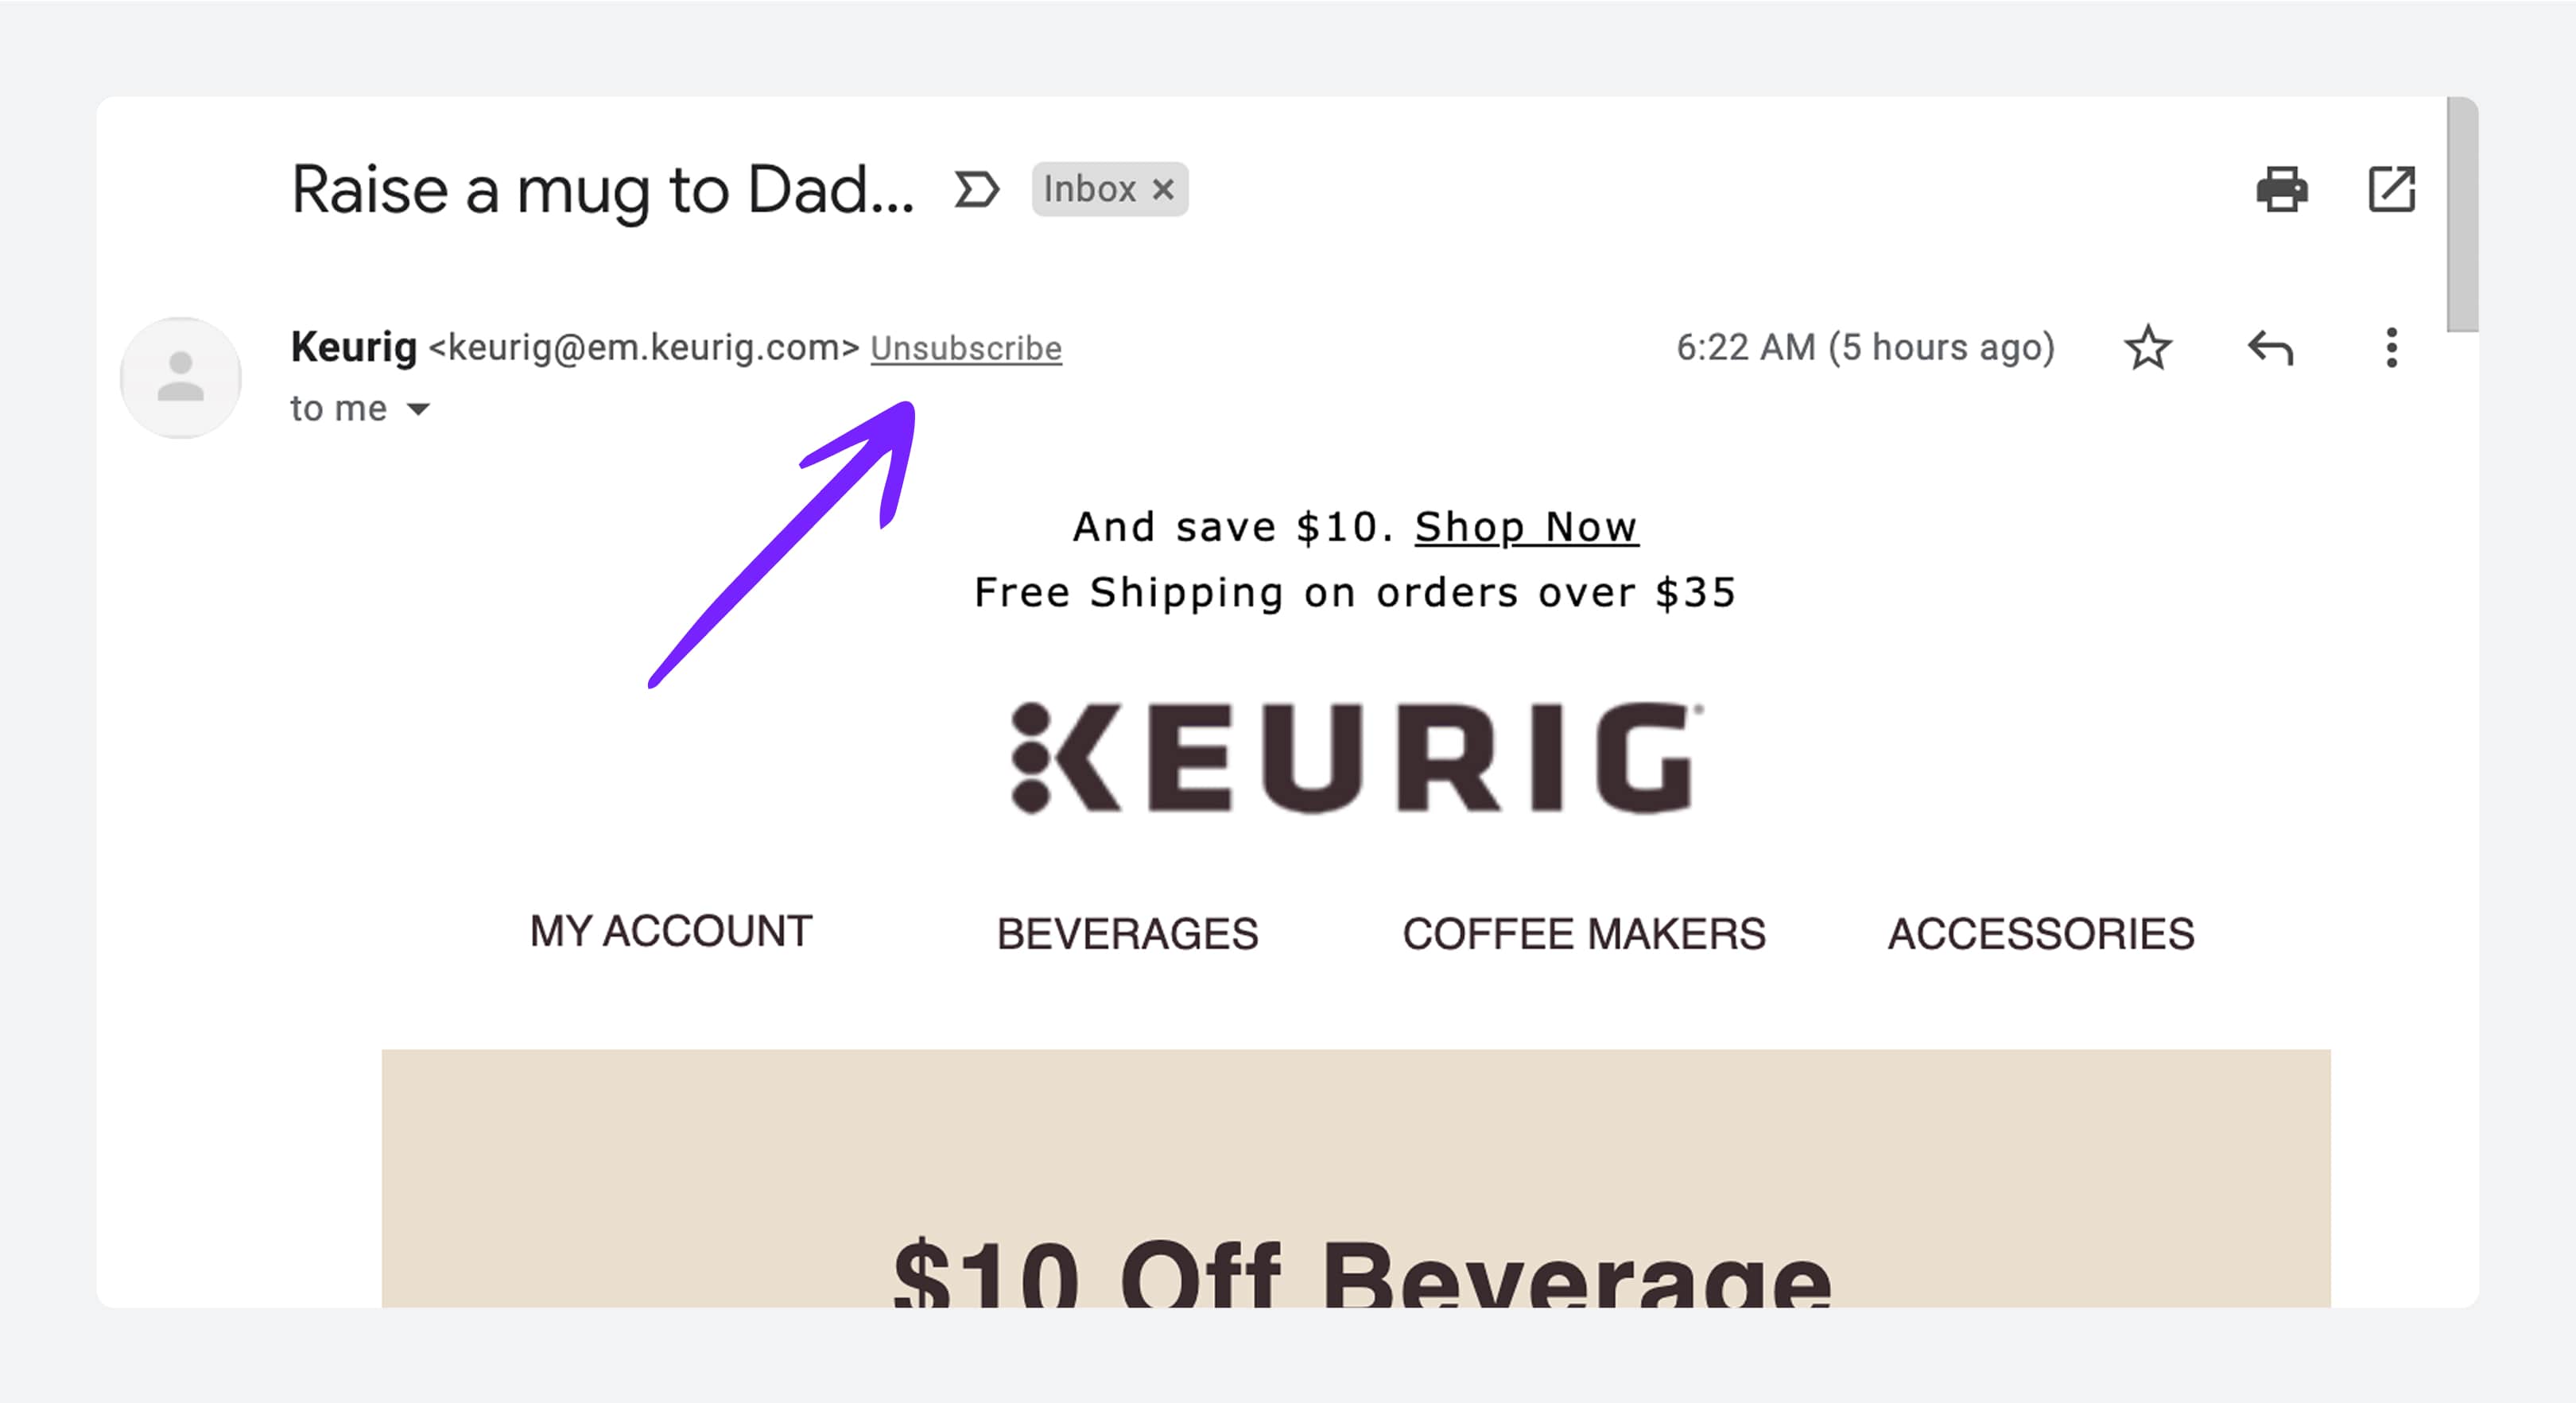
- Make your unsubscribe link easy to find (if someone wants out, you’d much rather they click “Unsubscribe” than “Report Spam.”)
Also, monitor engagement and suppress or re-engage inactive users. Many spam complaints come from old subscribers who forgot about you. If someone hasn’t opened or clicked in 6-12 months, consider removing them or at least sending a re-engagement email to confirm they still want in.
If they don’t respond, it’s safer to drop them before they potentially hit spam out of frustration. Keeping spam complaints low is crucial, so it’s worth the effort to polish your list regularly.
List Growth Rate
This measures how fast your list is growing (or shrinking). Healthy growth is important because email lists naturally decay by about 23% each year due to people changing emails or becoming inactive.
If you’re not adding new subscribers continuously, your list could be significantly smaller (and less active) a year from now even if you never had a big PR disaster. The average email list loses roughly a quarter of its contacts every year just to churn.
So, track your growth rate and also the sources of your subscribers. This is where opt-in method tracking comes in. Those who join organically via your content might be more engaged, whereas ones acquired through a random giveaway might churn faster.
By tagging or segmenting subscribers by source, you can measure which acquisition methods yield high-quality subscribers (who open, click, convert) and which are duds or have high unsubscribe rates.
If you run a campaign on social media that brings in 1,000 new sign-ups, but then you notice over the next two months, they barely open emails or unsubscribe, that’s a problem.
Meanwhile, a smaller batch of 300 subscribers from a webinar you hosted are super engaged and convert to customers at a high rate. That insight would push you to invest more in webinars or content marketing.
Growth for growth’s sake isn’t the goal; healthy growth is. And if you do any paid list growth (like running ads for an eBook download that collects emails), be extra cautious to get genuine opt-ins and set expectations.
WE ARE A FULL-SERVICE EMAIL MARKETING AGENCY
Engage customers, boost conversions, and drive sales with email marketing that works. From strategy and design to automation and deliverability, we help your brand reach the right inbox at the right time
Let’s talk – Schedule a call with our expert email marketing team today to see how we can help!
Behavioral & Predictive Metrics (2026-Ready)
Behavioral metrics track what subscribers do across their journey (not just single campaigns), while predictive metrics use data and AI to forecast future engagement or value.
Think of behavioral metrics as the patterns in subscriber interaction: Who are your most engaged subscribers overall? Who tends to open and click every time, versus who hasn’t touched an email in 6 months?
For instance, you might have a metric like “% of active subscribers” which is the proportion of your list that has engaged in the last 90 days. If that starts falling, it’s a sign that fewer people are finding your emails compelling.
Predictive metrics use algorithms to predict subscriber behavior. You can now get insights like:
- Likelihood to open
- Likelihood to click
- Likelihood to convert for each subscriber
Bonus: Channel-Specific KPIs for Different Email Types
Not all emails have the same job:
Newsletters
Newsletters are more about engagement and brand touchpoints than immediate conversion. So you’ll watch classic engagement metrics like open rate and CTR, but you might also include some content-specific KPIs:
Open Rate & Unique Opens
Since newsletters are regular, you can trend their open rates over time and aim to maintain or grow it. If you see open rates sliding, it might tell you that your content isn’t resonating. But given Apple MPP, focus on open trends among non-Apple segments if possible (or just look at click trends as a proxy).=
Click-Through Rate
Newsletters usually have multiple links (blog posts, news articles, etc.) instead of a single CTA. Overall CTR is good here, but which pieces get the most clicks is a key KPI. It tells you what content resonated. Many newsletter editors track the “top clicked story” each sends to learn subscriber interests.
Promotional Campaigns
Promotional emails are ones that push an offer: a sale, a discount, a new product, etc. They’re common in ecommerce and retail, but also used in B2B for events or limited-time content. These are more conversion-driven, so you’ll emphasize different KPIs:
Conversion Rate & Sales
The #1 metric for a promo email is usually how many sales (or sign-ups) it generated.
Bounce Rate & Deliverability
For major promos (like Black Friday blasts), keep an eye on bounce and spam complaint rates too. You might be emailing parts of your list that haven’t heard from you since the last big promo.
If possible, send to your most engaged subscribers slightly earlier, then to less engaged in a second wave, etc. This means initially you’ll have high engagement signals to ISPs so you can show that your emails are wanted, which improves the deliverability for the next batch.
List Growth via Promo
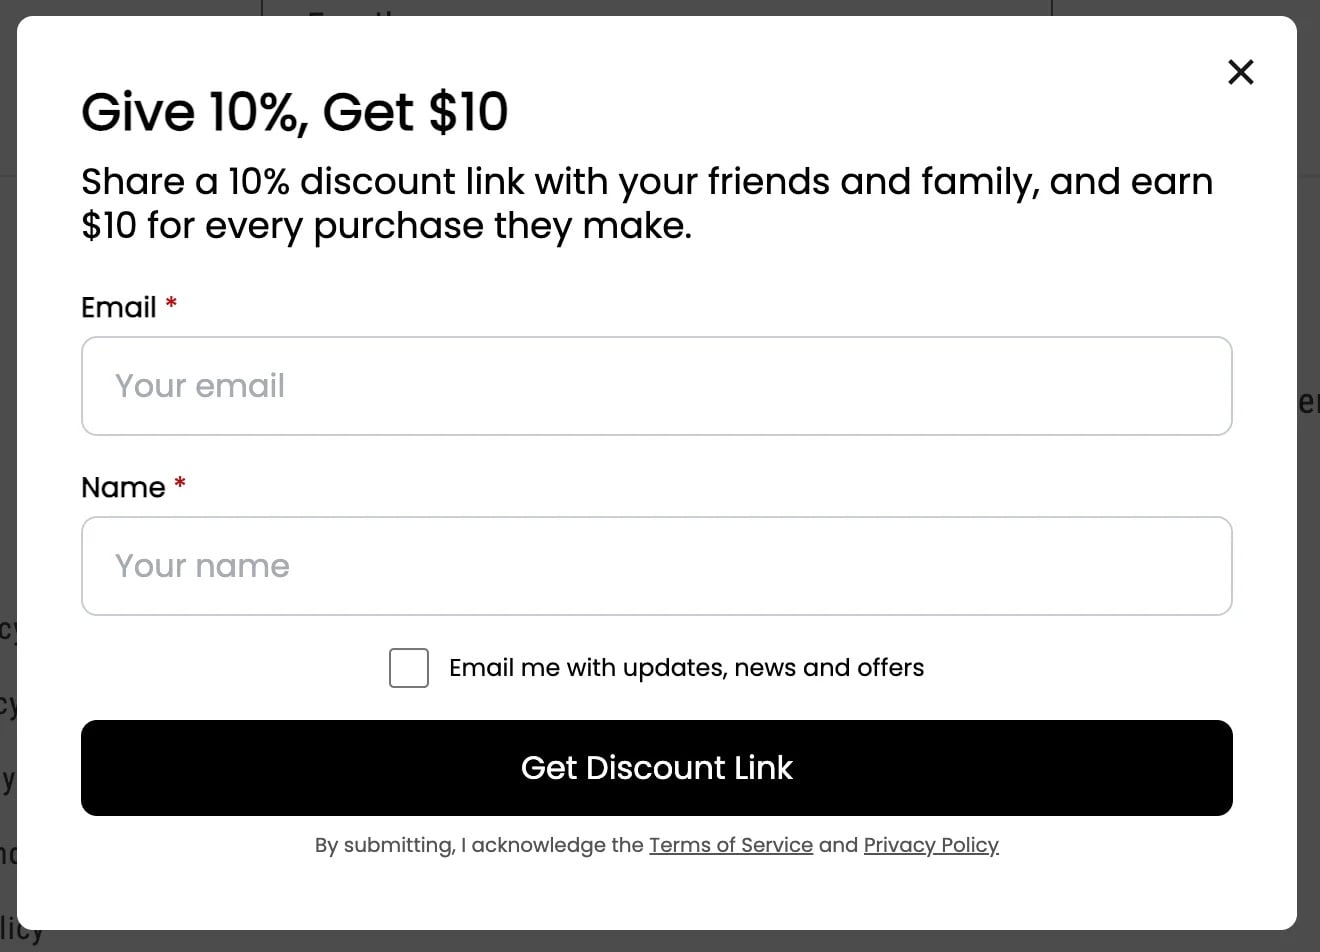
Sometimes a promotion can actually grow your list or social following (e.g., “share this with a friend to get an extra 10% off”). If you incorporate any viral or share component, track how many new sign-ups or referrals were generated.
Cart Abandonment Emails
These are automated emails sent to people who added something to their cart but didn’t complete the purchase. The metrics here are highly conversion-focused:
Recovery Rate
The primary KPI is the percentage of abandoned carts that are “recovered” (i.e., the customer came back and purchased) thanks to the email. These can be really effective as the average conversion rate is around 10% for cart abandonment emails. That’s huge when you consider these were otherwise lost sales.
Open and Click Rate
Cart emails tend to have higher open rates than typical promos because the intent was already there. The customer was this close to buying. Open rates of 40% or more are not uncommon, which is well above normal marketing emails.
Onboarding and Welcome Series
The KPIs for these are about activation and retention as much as immediate engagement:
Welcome Email Open Rate
Welcome emails are often in the 60-80% plus range for open rates because recipients are expecting them (they just signed up or made a purchase).
So if your welcome email isn’t being opened by at least half of new sign-ups, that’s a red flag. It might be going to spam or the subject line doesn’t make it obvious that it’s a welcome message. You want as many newcomers as possible to read that first email.
Click Rate and Key Action Completion
What do you want a new subscriber to do? Maybe:
- Set up their profile
- Read a getting-started guide
- Confirm their email
Measure the click rate on your primary CTA in the welcome email. Additionally, track the downstream action: e.g., of those who clicked “Complete Your Profile,” how many actually completed it?
Re-engagement Campaigns
The KPIs here revolve around how many customers you can “win back” and how many you decide to let go:
Unsubscribe/Removal Rate
A re-engagement campaign might ironically make some people unsubscribe. But this isn’t a failure because it essentially cleans your list for you. You should track how many unsubscribes it yields, as well as how many emails you end up removing.
Spam Complaint Rate
Since these contacts haven’t engaged in ages, some might not remember you and hit spam. One way to mitigate this is to keep the tone very gentle and maybe even not send to the oldest, stalest addresses.
How to Choose the Right KPIs for Your Business
The reality is, you should not track every KPI with the same diligence. Choosing the right KPIs to focus on depends on your business type and goals. Here’s how to navigate that:
Ecommerce
If you’re an ecommerce or retail brand, you’ll likely focus on conversion-oriented KPIs. Key ones would be:
- Conversion rate
- Average order value (AOV) from email
- Total revenue per campaign
- Email ROI
Engagement metrics still matter (they affect deliverability and funnel steps), but your main measure of success is in dollars and orders.
For example, an ecommerce might have a KPI stack like:
- CTR
- Conversion rate
- Revenue per email
- List growth
SaaS
If you’re a B2B SaaS or service business, your emails might be more about lead nurturing or user onboarding. A SaaS might define success as user activation and eventual upgrade. So their KPIs could be:
- Open rate (on onboarding sequence)
- Feature adoption rate (did they click and use a feature)
- Free to paid conversion rate
- Retention at 90 days
They might also track the user’s engagement score. For a service business using email for content marketing, KPIs could be newsletter engagement (open/click) and lead generation (how many demo requests or consultation sign-ups came via email).
Brand Awareness
If your aim is brand awareness or media, you could be sending emails that don’t directly sell anything but drive eyeballs to content or build loyalty. In that case, KPIs around engagement and reach are key:
- Open rate
- Read time
- CTR to content
- Social shares
- List growth
| Business / Goal | Primary Email KPIs to Focus On |
|---|---|
| Ecommerce/Retail (Sales) | Conversion Rate, Revenue per Email, CTR, Average Order Value, Cart Abandonment Recovery Rate |
| SaaS (User Activation) | Onboarding Email Open/CTR, Activation % (feature use or trial->paid), Churn Rate, Engagement Score |
| Content/Media (Engagement) | Open Rate, Clicks to Website, Time Spent on Content, Forward/Share Rate, Subscriber Growth |
| Lead Gen/Services (Leads) | CTR on CTAs (e.g., “Contact Sales”), Conversion to Lead (form fills from email), Response Rate (if using email for outreach) |
| Nonprofit (Donations) | Click-to-Donate Rate, Donation Conversion %, Total Donations from Email, List Growth (supporters) |
You’ll probably accomplish very little if you try to track and optimize every single metric we’ve discussed. Instead, pick a few actionable KPIs. “Actionable” means if the number moves, you know what to do about it.
Tools to Measure Email Marketing KPIs in 2026
There are plenty of tools and platforms that not only track email KPIs but also help you make sense of them:
Email Service Providers (ESPs)
Most likely you’re using an ESP or marketing automation platform to send your emails, which could be:
- Mailchimp
- Klaviyo
- HubSpot
- ActiveCampaign
- Campaign Monitor
- Sendinblue
- Constant Contact
- Marketo
- Salesforce Marketing Cloud (ExactTarget)
- Oracle Eloqua
These platforms have built-in dashboards for standard KPIs with nice charts. For example, Mailchimp will show you your open and click rates and even how they compare to industry benchmarks.
And these platforms have increasingly integrated AI and predictive features. For instance, HubSpot has a feature that can predict a contact’s likelihood to close as a customer (lead scoring) using AI.
Klaviyo (which is popular for ecommerce) can calculate predicted CLV (Customer Lifetime Value) for each customer. So within these tools, you’ll find some predictive KPIs like “Churn Risk” or “Expected Future Spend” that you can monitor.
If you’re trying to be cost-efficient with your email marketing, these platforms can show ROI by campaign if you input costs or integrate with ad spend.
Google Analytics 4 (GA4)
GA4 isn’t an email platform but it shows conversions attributed to email and user behavior. For example, you can set up a custom report in GA4 to see “Email - Purchases - Revenue” over time, or look at email-assisted conversion paths.
CRM and Integrations
If you use a CRM like Salesforce or Zoho, integrating email data into it allows you to measure deeper KPIs like lead-to-opportunity conversion (how many email leads became sales opportunities), or revenue won from email-sourced leads. For B2B, this is key.
HubSpot’s all-in-one platform, for example, can show that a particular email nurturing series influenced x number of deals and how much those deals are worth. It closes the loop from email to sales.
Nowadays, pretty much every major ESP has either built-in CRM features (like HubSpot, ActiveCampaign have CRM pipelines) or easy integrations (Mailchimp can sync to Salesforce, etc.).
So use these to tie email metrics to business metrics. It’s one thing to say “we got a 5% click rate,” but way more impactful to say “that email generated 20 demo requests, and 5 of those became customers worth $50k”.
Business Intelligence (BI) Dashboards
Some companies pull data from multiple sources (ESP, CRM, web analytics) into a BI tool like:
- Tableau
- Looker
- Power BI
- Google Data Studio
You could have a dashboard that, for instance, shows email send volume, open/click rates, conversion rates, and revenue, all in one place, updated automatically. It’s a bit of setup, but worth it if you’re data-heavy.
AI and Predictive Analytics Tools
Some tools (often add-ons to ESPs or features within them) can do things like:
- Analyze the best performing times
- Subject line sentiment analysis
- Generate content
For measurement, AI can comb through your historical data and say “these 5 contacts are hot leads” or “this segment is likely to churn.”
Common Mistakes to Avoid When Tracking Email KPIs
Steer clear of these:
Not Accounting for Privacy Changes
Don’t treat open rates or other metrics the same way as before Apple MPP (and similar privacy moves).
If you keep using open rate as a trigger in automations (“send follow-up to anyone who didn’t open”), you could be misfiring because some “non-openers” did open (but were hidden by privacy), and some “openers” actually didn’t (machine opens).
Instead, include click or downstream metrics to judge success.
Neglecting Deliverability Factors
Sometimes marketers look at falling open or click rates and think it’s content or timing, when actually their emails started going to spam. You might misattribute a KPI drop if you don’t monitor deliverability metrics (bounces, spam complaints, inbox placement if possible.
For instance, if open rates suddenly nosedive across all campaigns, don’t immediately blame the subject lines; first, check if your deliverability took a hit (bounce spike, block, etc.).
A common mistake is to double down on sending more emails to “improve results” when, in fact, those emails land in spam and make things worse.
Setting Unrealistic KPI Goals
Setting goals like “we need a 50% click rate” (unless it’s a very transactional email) will just demotivate the team. Goals should be based on your own baseline and reasonable uplift.
If you set crazy targets without a strategy change to back them up, you’ll either be tempted to game the numbers (which can lead to bad practices like sending only to your most active to inflate open rates) or feel like a failure despite making solid progress.
Failing to Tie Metrics to Action
A huge mistake is collecting data and doing nothing with it. If unsubscribers keep inching up and you don’t ask “why?” and try something, then tracking it is pointless. Every KPI you monitor regularly should have some kind of “if this moves in the wrong direction, we will do this” associated with it. It doesn’t have to be a formal plan for each, but at least an idea.
Comparing Your KPIs to Wrong Benchmarks
Don’t be upset because you read “average open rate is 25%” and you get 20%. If that 20% is bringing solid sales and your audience is different, it might be fine.
Use benchmarks as guidance rather than pass/fail criteria. For example, if you run an affiliate marketing newsletter (monetized by ads) your success might be measured more by click volume to affiliate links than by open rate. A general “open rate benchmark” isn’t that relevant there.
Ignoring the Human Element
Metrics are just aggregated numbers about human behavior. It’s easy to lose sight of the people behind them. If you find a KPI slipping, think about the subscriber’s experience: are we sending too many emails? Is our content actually useful to them? Are we building a relationship or just blasting promotions?
Maybe gather qualitative feedback (surveys or direct replies) rather than only looking at quantitative KPIs.
Final Thoughts
A few takeaways to leave you with: The quality of engagement always beats quantity of subscribers. So make sure you monitor those list health metrics and keep an engaged list rather than just growing a huge list with hollow numbers.
In addition, make sure you stay adaptable, because email metrics are always evolving (privacy changes, AI, etc.). And finally, KPIs help you optimize and prove value, but ultimately the goal is to build relationships and drive results through email.
Frequently Asked Questions
What Is the Most Important KPI to Track?
It depends on your goal. For ecommerce, conversion rate or revenue per email often matters most. For content marketers, click‑through rate shows genuine interest. So choose the KPI that directly measures your primary objective (sales, sign‑ups, engagement) and focus on improving that metric first.
How Has AI Impacted How We Measure Email Success?
AI adds predictive insight to email metrics. This means features like forecasting engagement and predicting customer lifetime value. It suggests optimal send times and content variations. AI-enhanced metrics shouldn’t replace your core KPIs, but they do help with segmentation and timing for better overall performance.
Should I Still Use Open Rate as a Benchmark?
Open rates are a rough gauge, but privacy changes (like Apple MPP) inflate them. Treat opens as directional and use them to spot trends or compare subject lines in controlled tests. Prioritize click‑through rates and conversion metrics for more reliable benchmarking, since clicks represent intentional engagement.
How Often Should I Review and Adjust My KPI Goals?
Revisit KPI goals every quarter to see if they still align with your business objectives and market conditions. Monitor key metrics weekly or monthly to spot trends. If significant shifts occur (such as deliverability issues or strategy changes), you can adjust them quickly rather than waiting for the next review.
What KPIs Are Best for Nurturing vs. Converting?
Nurturing emails should emphasize engagement metrics like click‑through rate and content interaction (like read time or resource downloads). Converting emails focus on more action‑driven KPIs such as conversion rate and cart recovery rate.
Is It Worth Calculating Lifetime Value From Email?
Yes. Estimating subscriber/customer lifetime value shows you how much each email-generated contact contributes over time. It helps you decide your acquisition budgets and content strategy as it shows which segments deliver the most revenue. Even approximate CLV helps you decide how much to invest in list growth and nurturing.
How Do I Track Email Performance Across Devices?
Use your ESP’s device‑breakdown reports to see open and click rates on mobile vs. desktop. Then supplement this with Google Analytics segments (UTM tags) to measure on‑site behavior and conversions by device. Finally, compare device engagement and conversion rates so you can optimize email design and send times for each audience.
Which KPIs Indicate Poor List Quality?
High bounce rates and elevated spam‑complaint rates (>0.1%) tell you there are issues with deliverability or relevance. Very low open and click rates (e.g., <5% open consistently) indicate disengagement. If large list segments haven’t engaged in months, it’s time to clean or re‑engage because quality trumps size.