

Content marketing is less about solely creating great articles and social posts and more about knowing whether those efforts are actually moving the needle. You're essentially making all this great content for nothing if you don’t have clear metrics on its impact.
So we’ll explore the most important KPI’s to see what difference your content is really making. This includes what’s working and what needs adjusting.
You’ll see how each metric ties back to your content strategy and your bottom line.
- The Purpose of KPIs in Content Strategy
- KPI Types Based on Funnel Stage
- Why KPIs Matter to Performance
- Why KPIs Don’t Tell the Full Story
- How to Choose the Right KPIs for Your Team
- How to Measure Content Marketing ROI
- Top Tools That Help Track and Visualize KPIs
- Top 5 Mistakes to Avoid When Tracking KPIs
- Final Takeaways
The Purpose of KPIs in Content Strategy
Key Performance Indicators (KPIs) essentially show you how effective your content is:
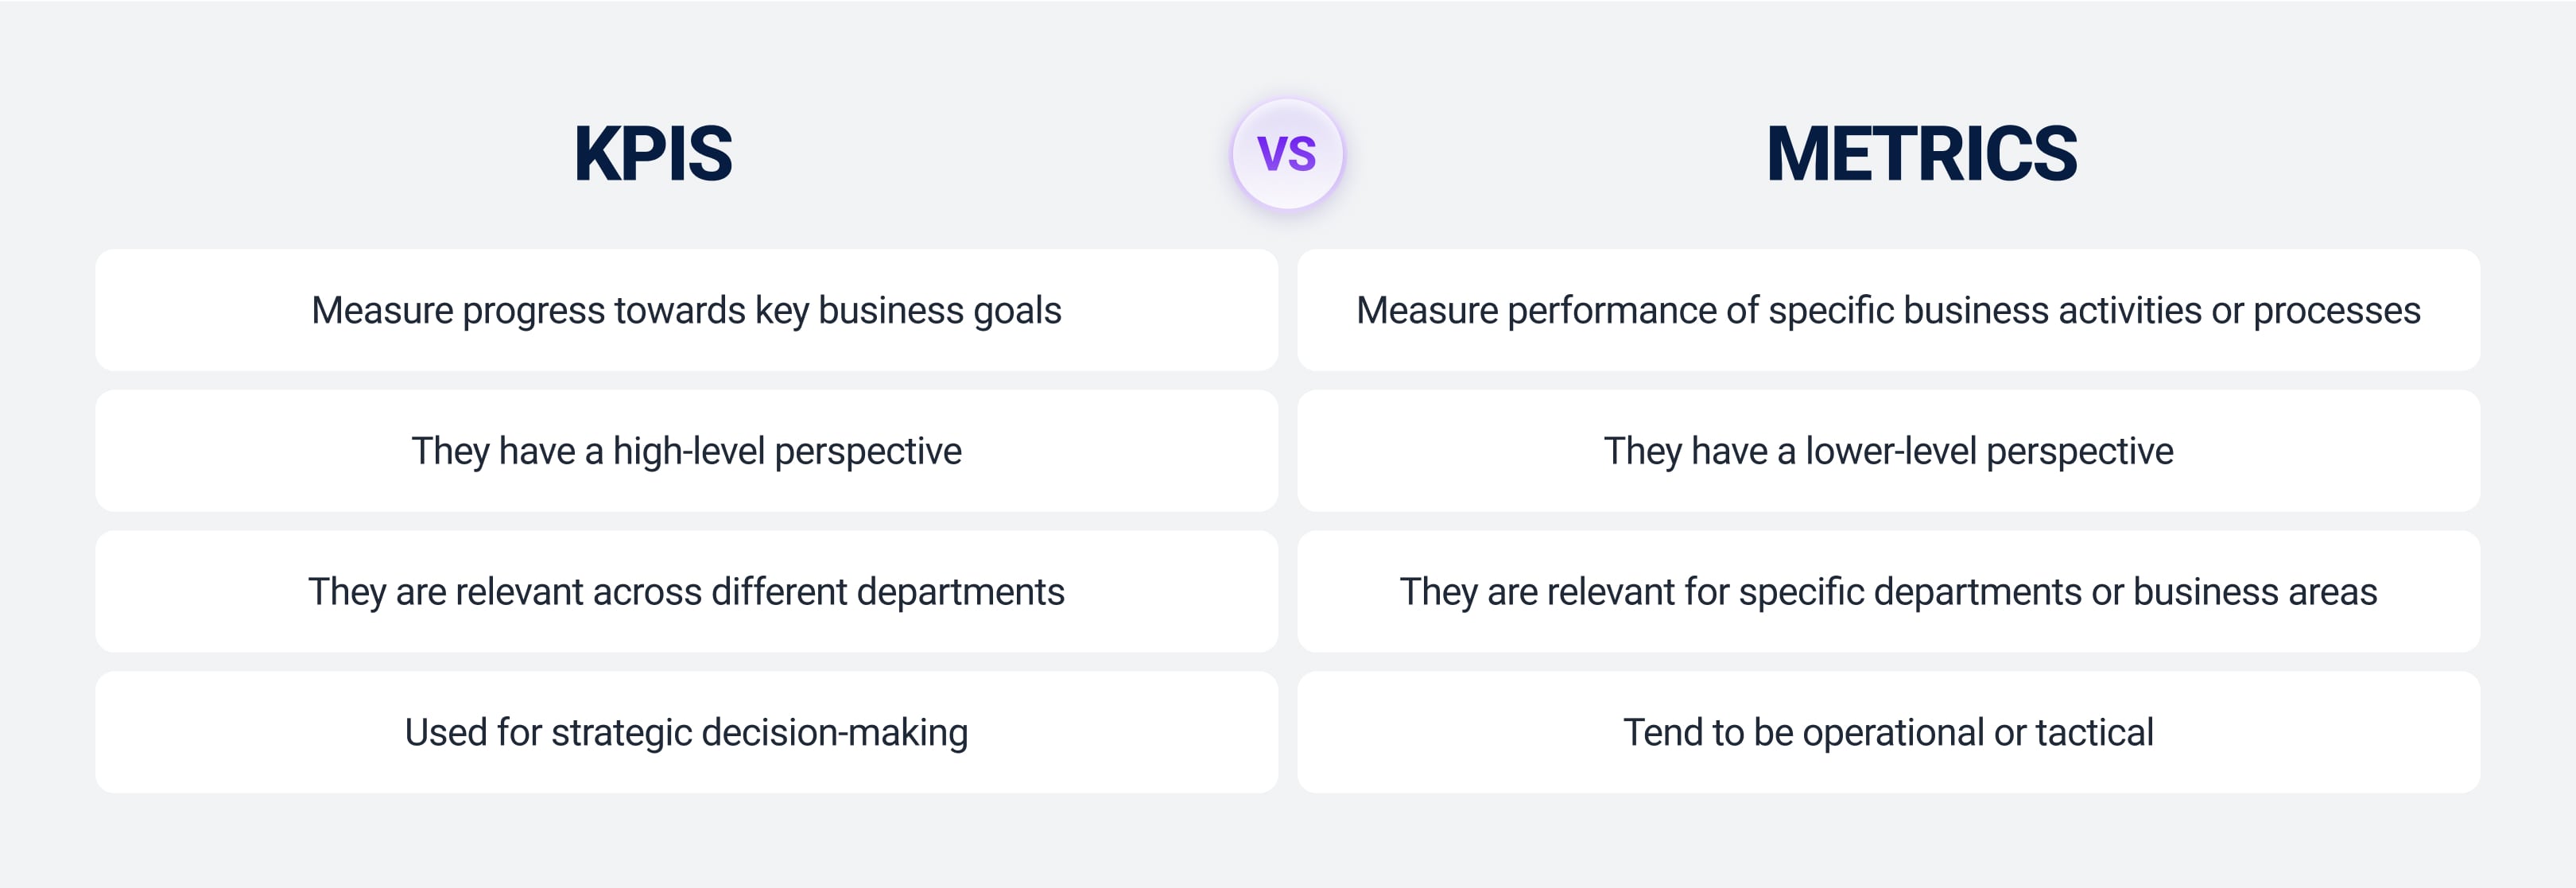
KPIs vs. Simple Metrics
A metric is just any measured data point. But KPIs are metrics that are tied directly to one of your business goals. For example, “website visits” is a metric; “website visits from our target audience that lead to sign-ups” is more like a KPI because it connects to a goal (lead generation).
KPIs focus on metrics that actually matter for judging success. That distinction is important because chasing random metrics doesn’t guarantee you any success while KPIs match your business objectives.
Aligning Content with Business Goals
Your KPIs are meant to make sure everything you create serves your larger objective. You’d want a KPI that shows organic website traffic growth or brand mentions resulting from your content if you want to increase brand awareness, for example.
A KPI could be the number of demo requests or whitepaper downloads attributed to your content if you want to generate leads. You learn what success looks like when you know what your preferred KPIs are.
When to Introduce KPIs in Your Content Program
You should start simple in the early stages with a few core KPIs once you have your strategy and baseline metrics in place. Have an initial period of content production (say, a couple of months) where you can gather some baseline data on basic metrics like traffic and engagement.
That lets you define your KPIs because you now have a better understanding of your goals. Want to get new users? Set a KPI for content-driven sign-ups once your blog has enough traffic to realistically generate sign-ups.
Just don’t wait too long because the sooner you define your KPIs the more direction you’ll have. You know what you’re working toward. But don’t get obsessed and introduce too many KPIs from the start, either. You can add more as your content program matures.
KPI Types Based on Funnel Stage
Good content marketing strategies target different stages of the customer funnel:
Awareness KPIs
These tell you how well your content is putting you on the map and attracting new users. They usually include:
- Impressions
- Website traffic/sessions
- Click-through rate (CTR) on content promotions
Organic sessions from SEO are especially valuable awareness KPIs because they show you’re pulling in visitors through search. This is why you need content that’s backed by a solid SEO strategy.
CTR is another one because it indicates how compelling your content titles or snippets are to the audience. This could be through a percentage of people who clicked your article after seeing it on Google or who clicked a call-to-action in an email.
At the awareness stage, you might also track brand mentions or press citations, since content like thought leadership pieces can lead to PR opportunities. For instance, a well-placed guest article might earn a mention in industry news.
At the awareness stage, you might also track brand mentions or press citations, since content like thought leadership pieces can lead to PR opportunities. For instance, a well-placed guest article might earn a mention in industry news.
Engagement KPIs
These ones tell you how people interact with your content once they’ve found it. Key metrics here include:
- Time on page
- Scroll depth
- Bounce rate
- Social shares
- Comments or interactions
Time on page tells you if your visitors are actually consuming your content properly or just skimming and bouncing, so you can infer from this whether or not your content is resonating.
Scroll depth tracking is similar (how far down the page people scroll) but better for long-form content. If most readers only make it 25% down your blog post, maybe the intro isn’t compelling enough.
Social engagement metrics (likes or retweets) show people read your content but also find it good enough to share with others. So it’s a strong sign of audience engagement if your article gets a lot of shares on LinkedIn, for example. And it boosts your content’s reach via social channels, which is good for awareness.
Conversion KPIs
This is the make-or-break stage where engaged audience members take a desired action. Conversion KPIs measure how well your content is driving results that impact your bottom line. Depending on your goals, that could be:
- Form fills
- Newsletter signups
- Demo requests
- Add-to-cart actions
- Direct purchases attributed to content
A common conversion metric for B2B content marketing KPIs is the number of leads generated by content. This could be how many people downloaded your whitepaper and filled out their contact info (becoming a lead for sales follow-up).
You might track how many sales or checkout completions occurred after a user engaged with a piece of content for B2C or ecommerce (perhaps via a tracked link).
These KPIs are usually the most critical since they tie your content directly to revenue, which is why 73% of B2B marketers use them as a key metric to measure content performance.
Retention and Post-Conversion Metrics
Your content should keep delivering value after someone becomes a customer or lead, so retention KPIs focus on how content contributes to keeping your audience engaged over the long term.
Examples include:
- Email newsletter engagement
- Returning visitor rate
- Content consumed per user
- Customer retention rate influenced by content
Have an email newsletter you fill with content? Track metrics like click-through rate and how many newsletter subscribers eventually reconvert.
Offer educational content to existing customers (like how-to guides or webinars). Measure product adoption or reduced churn as a result.
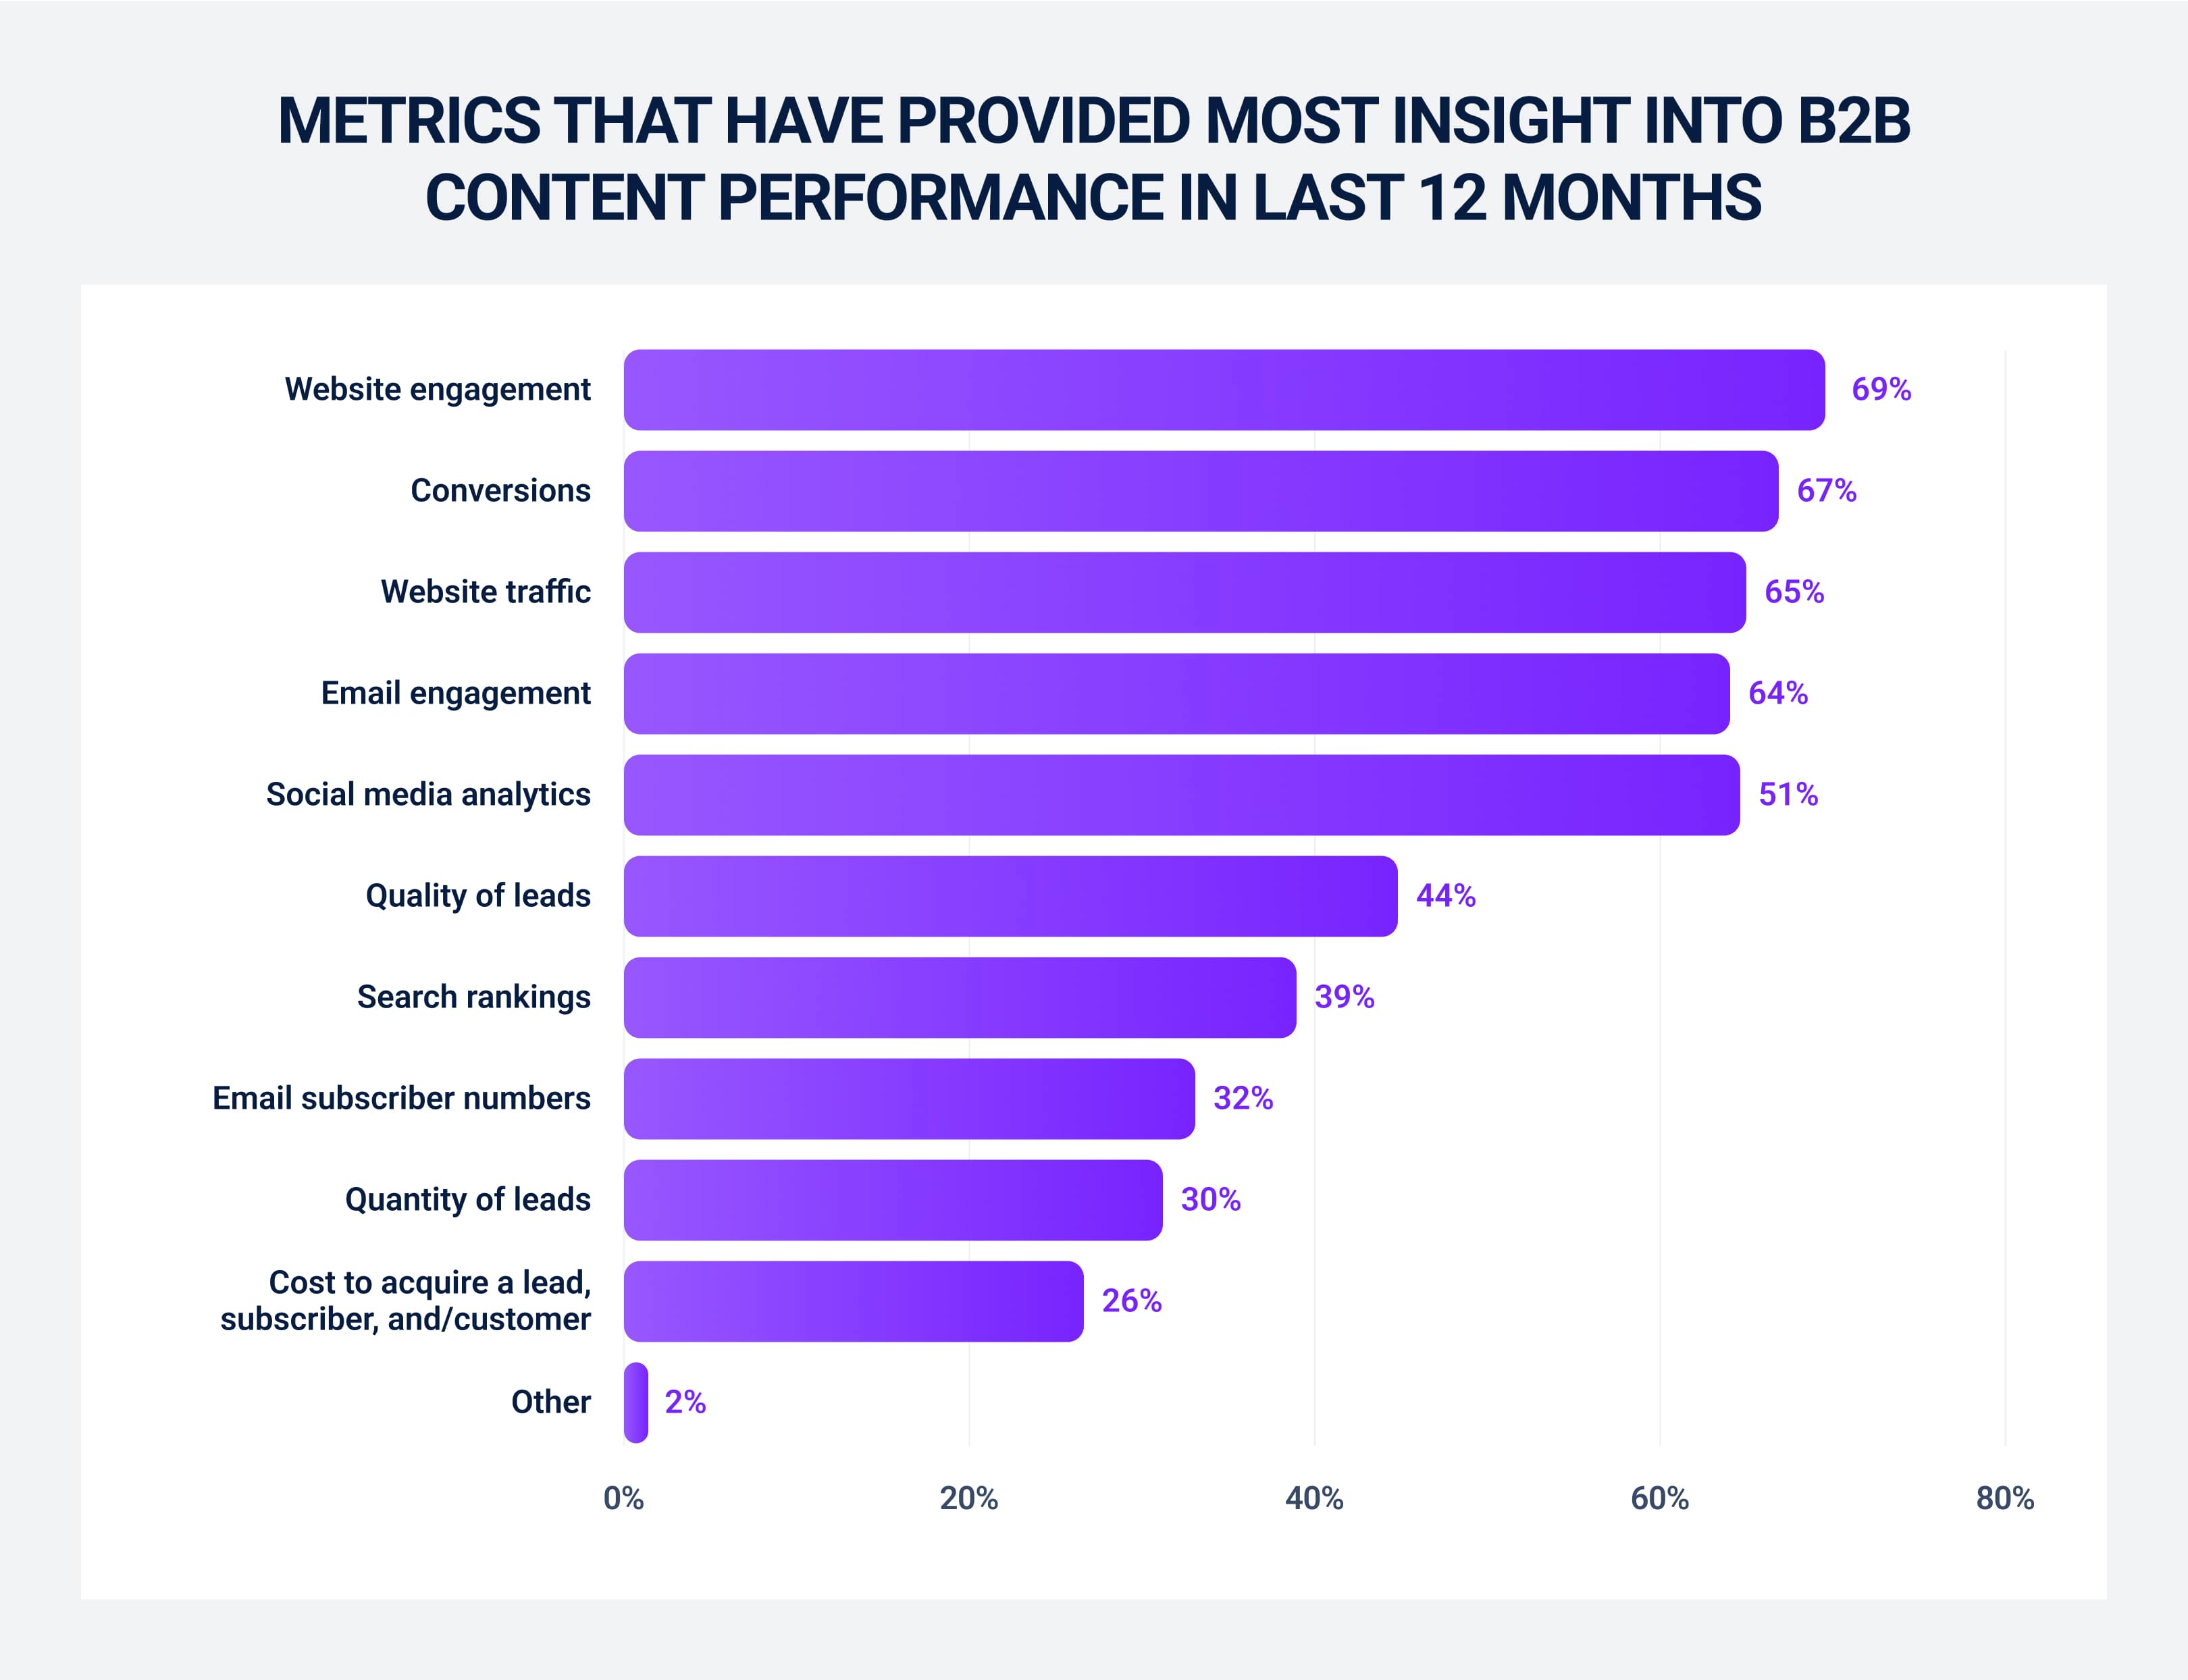
69% of B2B marketers say website engagement metrics are best for measuring their content success. Conversions (67%) are next, and website traffic (65%) is third.
This highlights how engagement and conversion data are considered more telling than basic traffic counts.
Interestingly, measures of lead quality (44%) and search rankings (39%) were somewhat lower, and the quantity of leads (30%) or cost per lead (26%) ranked near the bottom (as seen above).
This tells us that marketers value the depth and outcomes of engagement more than just sheer volume metrics. Keep this in mind so you focus on quality over quantity when defining your own KPIs.
Why KPIs Matter to Performance
You could track every tiny metric that exists, but it just leads to data overload. You know exactly where to aim when you choose a handful of KPIs tied to your goals (“email sign-ups from blog posts,” for example). No more obsessing over random Facebook likes or vanity numbers. Instead, your team focuses on the stuff that actually impacts your bottom line.
If your aim is to have an average time-on-page of about two minutes but you’re stuck at one, you’d be tweaking stuff aimlessly if you weren’t tracking that. With a clear KPI, you can try:
- Longer intros
- More visuals
- A different structure entirely
You know exactly how to push harder next time once you see the numbers.
KPIs also tell you what’s not working. Maybe your fancy infographics are racking up views but few leads, while your webinars (with smaller audiences) are converting like crazy. That insight lets you reallocate resources (more webinars, fewer one-off visuals) and get the best ROI. It’s data telling you where to double down and where to pivot.
And they’re also very effective in meetings. Handing over a dashboard that shows “Content drove 500 leads this quarter, equal to 20% of our sales” speaks volumes. Executives love numbers that tie straight back to revenue.
Why KPIs Don’t Tell the Full Story
KPIs, as critical as they are, don’t automatically reveal everything you need to know. They’re typically outcomes, not explanations. A KPI can tell you what happened (e.g., conversion rate dropped to 1% this month), but often not why it happened. Many external or qualitative factors can affect your KPIs, so the numbers alone won’t capture those nuances.
The number alone might suggest your content is poor if your time on page KPI plummets for a particular article. But the full story could just be that the article answered the question very efficiently, so readers got what they needed in 30 seconds and left happy. This means your content actually succeeded, despite the “poor” KPI.
Metrics without context are useless here. It’s on you to dig deeper and interpret what a KPI is high or low, which you can do through:
- Qualitative analysis
- User feedback
- Segmenting data
Can Be Misinterpreted or Misleading in Isolation
One classic example is bounce rate which can be seen as a negative if it’s high. But again, high bounce rates on a content page might just mean the visitor got all the info they needed (so they didn’t click elsewhere).
The KPI “high bounce rate” could falsely imply failure when the user’s need was actually met perfectly.
Similarly, a low number on a KPI isn’t always bad because quality matters. If your content conversion rate is 0.5%, that might look awful at first glance. But what if those 0.5% are enterprise clients worth millions? Suddenly that KPI in isolation didn’t tell the whole story of value.
Tunnel Vision
When you have a KPI, sometimes everything looks like it should be optimized for that KPI, potentially at the expense of a broader strategy. For example, if you over-focus on a content KPI like social shares, you might be tempted to clickbait headlines to boost shares.
The KPI will probably go up, but it’s going to damage trust and the quality of your content in the long run. For businesses that do a lot of affiliate marketing, you’ll know that loss of trust can be a massive issue for your business.
Or your team might fixate on increasing pageviews (because it’s a KPI) and end up pumping out lots of shallow articles.
This is why it’s important to balance KPIs with quality measures and use multiple KPIs. No single KPI should drive your entire strategy.
WE ARE A FULL-SERVICE CONTENT MARKETING AGENCY
Attract, engage, and convert with content that drives real results. From strategy and storytelling to blogs, video, and social media, we create and distribute content that connects your brand with the right audience.
Let’s talk – Schedule a call with our expert content marketing team today to see how we can help!
Hard to Quantify
Some parts of successful content are hard to quantify. But KPIs, by definition, are quantifiable. Except content marketing also influences things like brand sentiment and authority, which are unquantifiable.
You might publish a landmark industry research piece that gets relatively few conversions (so KPI says it’s bad), but it earns your brand a reputation as a thought leader that pays off big in partnerships or future sales (harder to measure directly).
These are intangible outcomes, which means KPIs don’t do your content justice. They don’t always capture the ripple effects content can have.
That’s why you need to complement KPI tracking with:
- Qualitative feedback
- Anecdotes
- Case studies
- Broader business indicators
For instance, tracking something like “brand search volume” or doing periodic brand surveys can add context that pure content KPIs might miss (like showing that people are searching your brand more after a content campaign, even if direct conversions were modest).
How to Choose the Right KPIs for Your Team
How do you pick the ones that really matter for your team?
| Key Principle | Which KPI to Choose | How It Helps |
|---|---|---|
| Align KPIs With Business Goals | Content‑influenced MQLs per month | Ties your content efforts directly to lead‑generation targets, which ensures every piece supports company objectives. |
| Focus On Actionable Metrics | Conversion rate on blog CTAs | Points to specific actions (e.g., tweak CTA placement) when performance dips, which helps you know your next steps. |
| Make Sure KPIs Are Measurable | Organic sessions growth rate | Points to specific actions (e.g., tweak CTA placement) when performance dips, which helps you know your next steps. Uses a defined data source (GA4) and regular cadence, so you can track progress reliably over time. |
| Set Realistic and Achievable Targets | % Increase in newsletter sign‑ups (quarterly) | Grounds goals in historical trends, which keeps your targets motivating yet attainable and builds team buy‑in. |
| Prioritize Relevant KPIs for Your Team | Pages per session for content hub | Focuses on engagement metrics that the content team can directly influence, which avoids data overload |
| Regularly Review and Adjust KPIs | Quarterly change in content-driven revenue | Makes sure your metrics stay aligned with your goals and that underperforming KPIs are retired or refined. |
How to Measure Content Marketing ROI
ROI is just a simple formula:
- ROI = Net Return/Investment x100%
For content marketing, you’d calculate Content Marketing ROI as:
- Revenue from content efforts - Cost of content efforts/Cost of content efforts x 100%
You’re calculating how much revenue your content generated relative to what you spent on it and expressing it as a percentage. So if you spent $1,000 on creating and promoting content in a month and you know $5,000 of your revenue was down to that content, your ROI is 5000-1000/1000 x 100 = 400% (a 4x return).
The challenge is how you definitively know that “revenue from content” part because your content usually has an indirect or longer-term revenue impact.
Attribute Revenue (or Conversions) to Content
To measure content ROI, you need a way to connect content interactions to eventual conversions or sales, which is where your analytics and attribution tools are handy.
Start by defining what a “conversion” means for you. It could be an ecommerce sale, a lead form fill, a subscription, etc. Then ensure you’re tracking user journeys. Tools like Google Analytics 4, for instance, allow you to see pathways and conversion events which you can tag content to track its influence.
Remember that content often works in a multi-touch, assistive way. A potential customer might:
- Read a blog today
- Watch a webinar next week
- Buy a month later after seeing a retargeting ad
Your content ROI measurement has to account for those assists, not just last-click. Multi-touch attribution models (like linear or time-decay models in Google Analytics or attribution software) can assign fractional credit to content touchpoints. It’s not perfect, but it’s better than ignoring content’s influence.
You might present your content ROI as, for example, “Our content contributed to $50,000 of pipeline this quarter and $10,000 of closed sales.” This acknowledges that your content might not get 100% credit for those sales, but definitely played a role.
Assign Monetary Values Where Direct Revenue Isn’t Available
If you can’t track direct sales from content (common for top-of-funnel content where conversion might happen much later), one method is to assign a monetary value to conversions or leads.
For example, if your sales team knows that 1 in 10 leads becomes a customer and each customer is worth $1,000, then each lead is “worth” about $100 on average.
So, if your whitepaper download generated 50 leads, you could estimate it generated $5,000 in potential value. It’s a rough proxy, but it helps quantify ROI when direct revenue is murky.
Similarly, for things like email sign-ups, you might estimate their value based on lifetime value or historical behavior. But remember that they’re estimates so you should label them when you’re calculating ROI.
Factor In the Costs
Don’t forget to tally up all relevant content costs. That includes:
- Content creation (writer salaries or freelance fees, video production costs, etc.)
- Content distribution (like paid promotion)
- Tools (maybe your content marketing platform subscription)
- A portion of salaries if your team members spend significant time on content.
Some of these costs are one-off (e.g., a big piece of pillar content) but others will be ongoing (monthly blog posts). You might measure ROI per campaign or piece (like ROI of our big eBook project) or overall ROI for content marketing over a quarter/year.
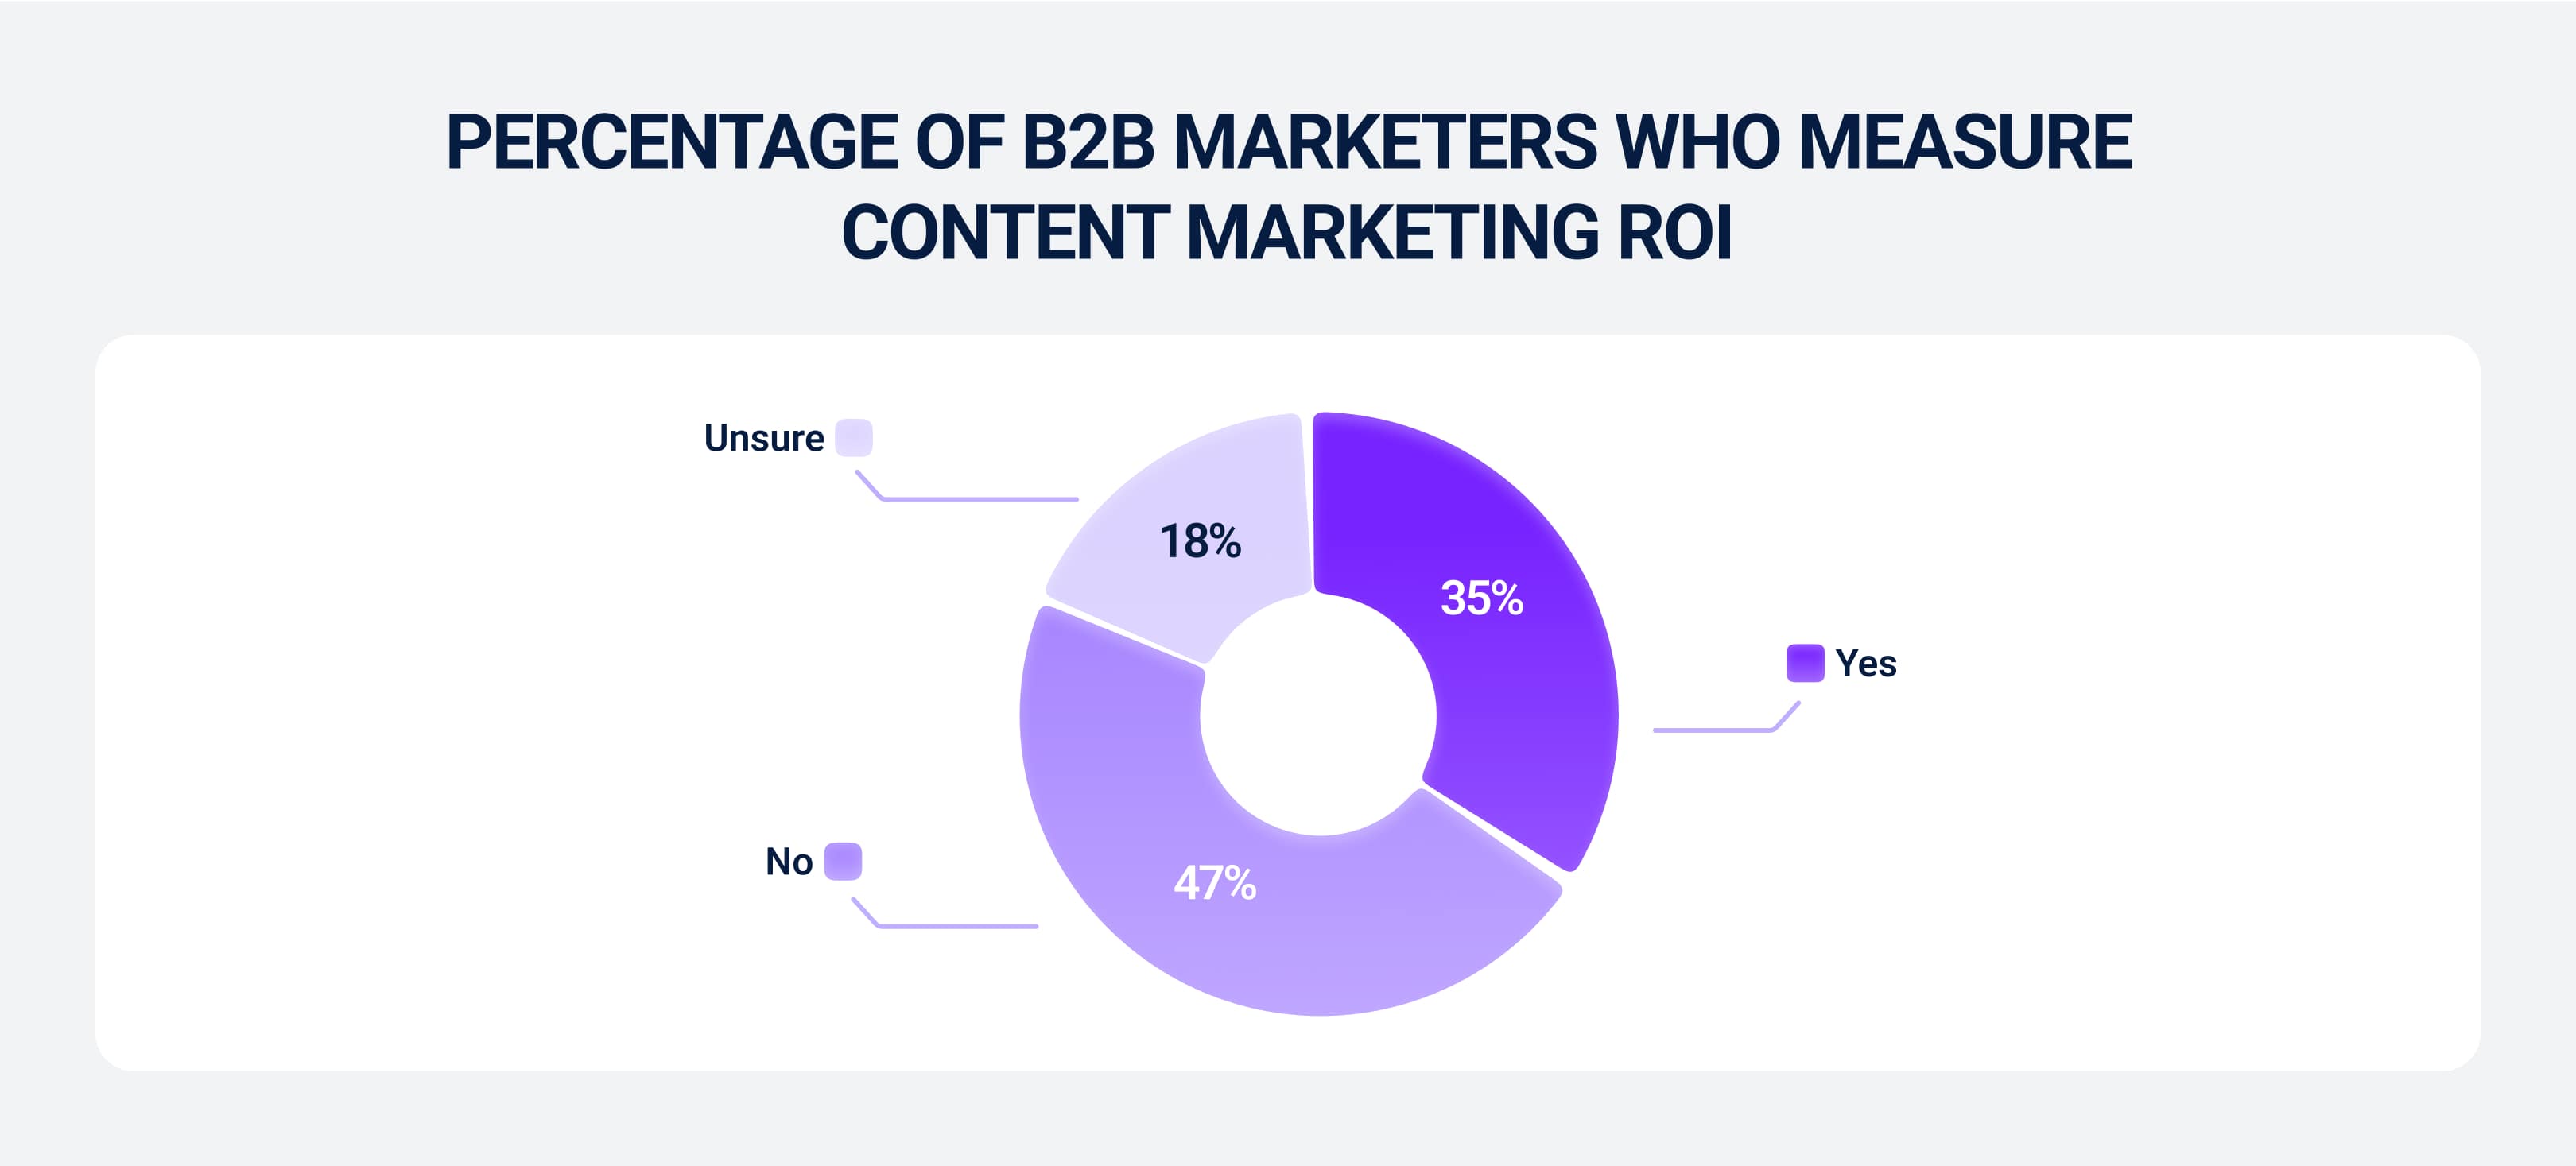
Keep in mind that a significant number of marketers either don’t measure content ROI or feel unsure about it. Don’t let that discourage you. You can still measure ROI and use those insights to make smarter decisions (and to secure that next content budget increase).
Your content marketing ROI won’t be immediate but it can be substantial when you measure and optimize it over time.
Top Tools That Help Track and Visualize KPIs
These are some of the best analytics and reporting tools out there:
Google Analytics 4
You use this for tracking website content metrics like:
- Traffic
- User behavior
- Conversions
GA4 gives you engagement data (e.g., average engagement time, scroll, events) and allows you to set up conversion goals, so it’s ideal for monitoring awareness and engagement KPIs on your site. Plus, it’s free and integrates with many other tools.
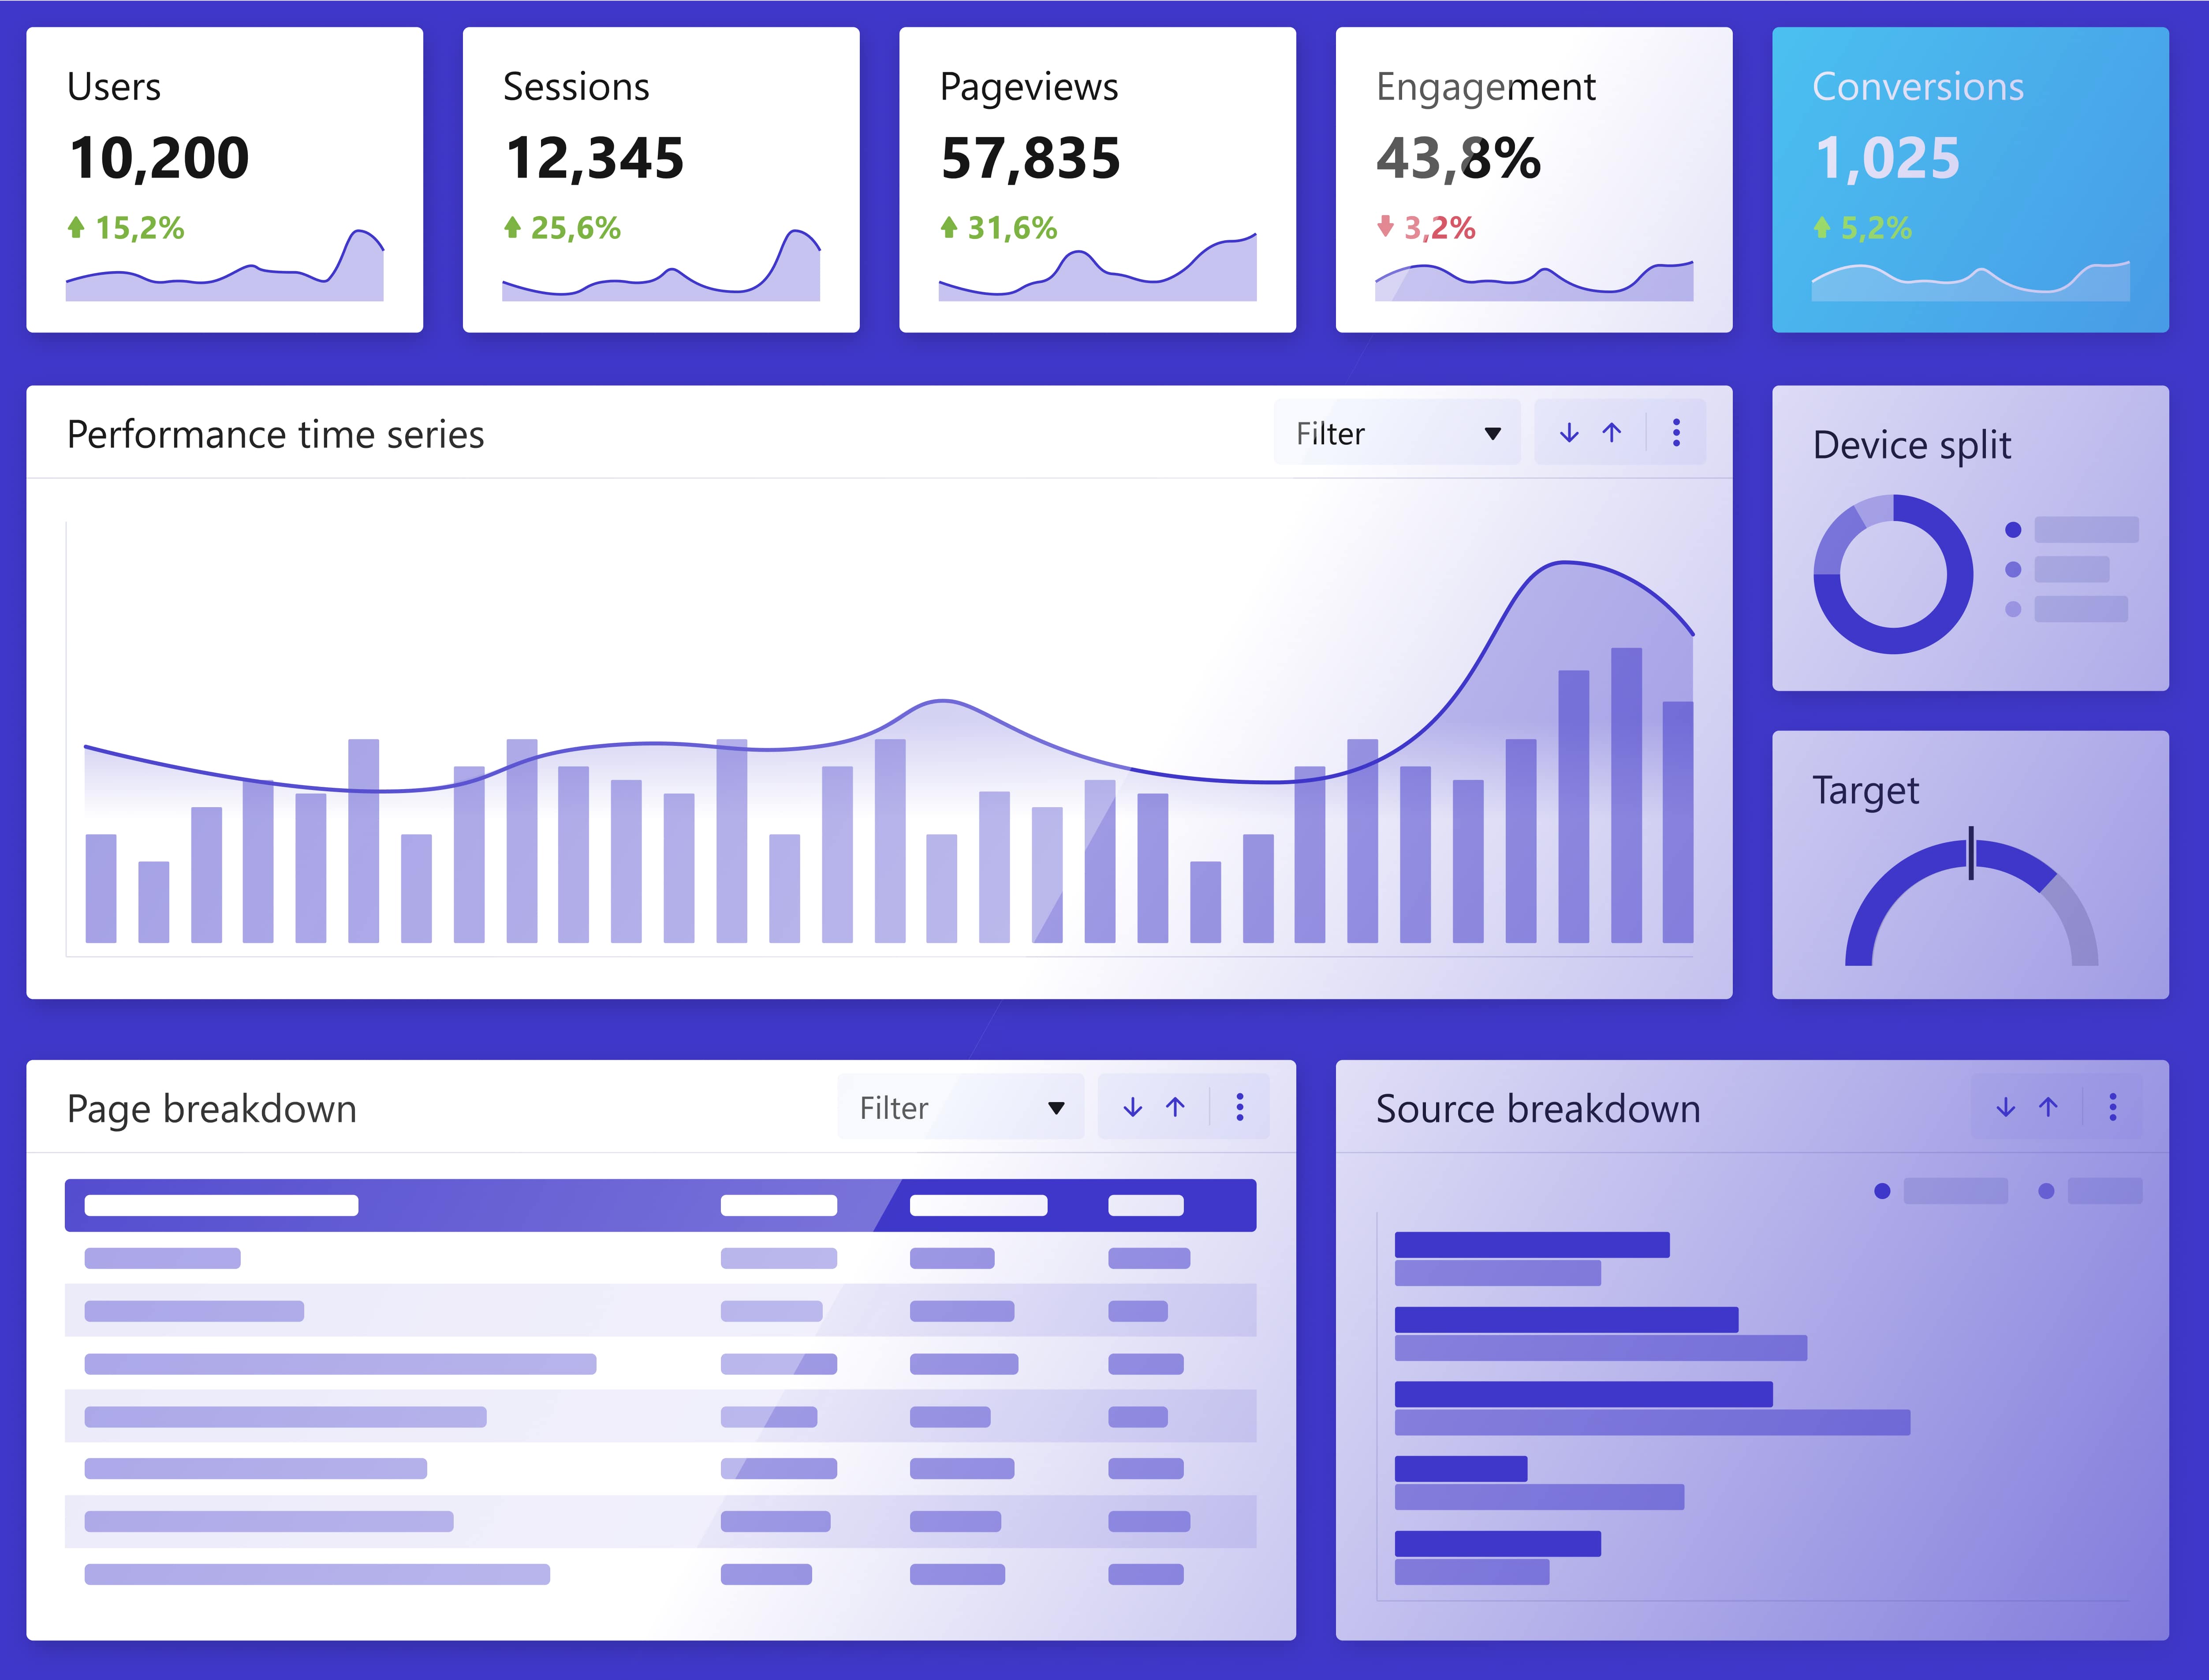
Looker Studio and Custom Dashboards
This one helps you visualize your KPIs in an easy-to-understand way. Google Looker Studio (formerly Data Studio) lets you pull data from GA4 and Google Search Console so you can create shareable dashboards.
You can also build custom KPI dashboards that combine multiple sources (e.g., web analytics + social + CRM). This is perfect for reporting to stakeholders because you can share charts and graphs of progress rather than just raw numbers.
SEO and Keyword Tools
Monitor a few SEO-related KPIs such as:
- Search rankings
- Organic impressions
- Keyword performance
You can use free tools like Google Search Console to see CTR and impressions for your content in search results, but if you actually want to track keyword rankings and backlinks (useful for awareness KPIs and content reach), use Ahrefs or SEMrush.
And these can also help tie your content to SEO outcomes as they can show you increases in organic traffic or improvements in ranking position for the keywords you’re targeting.
CRM & Attribution Platforms
Use these to connect your content to leads and revenue, which means you can see even deeper KPIs and ROI. Use something like HubSpot or Salesforce; anything that can log when a lead interacts with content (via tracking pixels or logged activities).
Afterwards, you can use the attribution reports you get to see how your content influenced sales. Dedicated attribution analytics tools (e.g., Attribution, Rocker box) can also automate multi-touch attribution models.
These KPIs are really important for conversions and lead quality since you’ll see real business outcomes.
Top 5 Mistakes to Avoid When Tracking KPIs
Avoid these mistakes when tracking your KPIs:
Focusing on Wrong Metrics
One big mistake is focusing on the wrong metrics, often referred to as vanity metrics. These are numbers that look impressive but don’t actually correlate with your core goals.
Raw page views or social media follower counts are vanity metrics if they’re not leading to engagement or conversions. Blog posts that get 10,000 views don’t do anything if the bounce rate is high and no one converts.
But 1,000 views on a targeted piece that yields 50 leads is far more valuable. Chasing high numbers sounds good when you’re bragging but make sure they represent meaningful progress.
Ignoring Data Context
Ignoring context is a classic mistake that can lead to misinterpretation of KPIs. Context can mean several things:
- Comparing against past performance
- Considering industry benchmarks
- Looking at segments
- Qualitative context
If your average time on page KPI drops, is that bad? What if overall site speed improved dramatically so people find what they need faster? Or maybe that drop is only for mobile users (segment context) and there was a bug on mobile causing issues. Without context, a KPI is just a number on a screen; it’s hard to judge if it’s “good” or “bad.”
For example, a 5% conversion rate might sound great for some industries and terrible for others. If you ignore the context of what’s typical, you might set wrong expectations.
Not Aligning KPIs With Business Goals
You’re going to be optimizing for the wrong outcomes if your KPIs don’t map to business goals. Like if your business goal is to increase subscription revenue, but your content team is focused on a KPI like “blog traffic,” you might drive loads of low-quality traffic with clickbait or unrelated topics just to hit that traffic number. But that doesn’t translate to subscriptions.
Another scenario is when your business strategy pivots but your KPIs don’t. Say your company moves upmarket to target enterprise clients and starts valuing quality over quantity, but your content KPIs remain quantity-driven (like number of leads, regardless of quality). Suddenly, you might be flooding sales with a bunch of small leads while they want big ones.
Failing to Update KPIs Regularly
Your KPIs are probably going to be outdated or irrelevant by now if you chose them two years ago and haven’t touched them since. Perhaps you’re missing KPIs for a new content format, or maybe one of your KPIs has consistently flat-lined and no longer serves as a useful gauge.
Moreover, not updating can lead to KPI fatigue; people stop caring if the KPIs always paint the same picture or aren’t talked about in the context of your current goals.
Overcomplicating the Tracking Process
This happens when you design an overly complex measurement system that is:
- Time-consuming
- Convoluted
- Hard for stakeholders to understand
One sign of overcomplication is simply having too many KPIs. Another sign is tracking the same thing in multiple ways unnecessarily (like using three different tools to report the same metric, which might even give slightly different numbers and cause confusion).
Also, if you manually export and chart data across 10 Excel sheets every month, that’s a process you should really be streamlining or automating because it wastes both time and the chances of errors.
Overcomplication also makes it hard for others to engage with the data. If your CEO asks for a quick sense of content performance and you present a 20-slide deep dive with technical metrics, you’ve lost them. Better to have a clear report of top KPIs with maybe an appendix for people who want to dig deeper.
How to simplify?
- Use the tools and integrations (like linking GA to your reporting tool so it updates automatically)
- Reduce duplication
- Focus on clarity
A rule of thumb: if you can’t quickly explain to a colleague what a KPI means or how you got the number, it might be too complicated. This is particularly crucial if you have limited analytical support. You don’t want to build something that only one person knows how to run, and then if they’re absent everyone else is stuck.
Also, consider training and documentation as part of the process. Document how KPIs are tracked and calculated in plain language. That way, if someone new joins, they can follow along and you avoid a knowledge silo.
Final Takeaways
Some tips to leave you with: Only measure what matters. Have a few KPIs that are tied to different stages in your funnel and forget about the rest so you don’t get overwhelmed with numbers. This also means building a lean toolkit. It’s good to use GA4 and various SEO tools, but keep all your reports focused on your core KPIs.
All those KPIs are useful, but stay creative and data-driven. Your KPIs should inform your content, but don’t forget about your storytelling to actually bring those metrics to life with genuine audience value.
Also, try to be flexible. Your business goals are going to change at some point so you don’t want to keep the same targets and metrics you had back when you started.
Lastly, communicate your results! Share any wins and learnings you get with your team and stakeholders so everyone sees how your content drives traffic and leads.
Frequently Asked Questions
What Are the Most Important Content Marketing KPIs?
Key content marketing KPIs are any metrics that align with your goals. This includes everything from organic website traffic for awareness and engagement measures like average time on page or scroll depth to other metrics like form submissions or demo requests. And content-driven revenue or ROI is also crucial.
How SEO-Optimized Content Impacts Marketing KPIs?
It helps because it improves search visibility and organic traffic. You’re able to attract visitors with higher intent who engage better since you’re targeting relevant keywords and making sure everything loads quickly. Higher engagement metrics often lead to stronger conversion KPIs. Then over time, SEO-focused content grows your traffic and ROI sustainably.
Can Bounce Rate Be a Misleading KPI?
Bounce rate measures the percentage of visitors who leave a page after viewing it. So a high bounce rate could be a failure, but it could also be that users just found what they needed quickly and departed. That’s why it’s important to consider bounce alongside other metrics like average session duration or conversion rate to understand intent.
How Do I Measure the Impact of Content on Lead Generation?
Measure content’s impact on lead generation by tagging and tracking interactions. Assign UTMs to content links directing to forms or landing pages. Ensure automated analytics records conversion events like downloads or form submissions. In your CRM, attribute your leads to the content source via first-touch or multi-touch models. Analyze monthly conversion rates.
What’s a Good Benchmark for Content Conversion Rate?
Content conversion rate benchmarks depend on industry and format. Ungated blog posts typically convert 1-5% of readers to email sign-ups or other actions. But for gated/paywalled assets like eBooks or webinars, you usually see landing page conversion rates between around 15% and 45%
What KPIs Reflect Content Quality, Not Just Quantity?
Content quality KPIs focus on engagement. This includes metrics like average time on page and repeat visitors, since these indicate how well your content resonates. Social shares and inbound links are another good way of gauging audience approval and credibility.